Table of Contents ▼
- TL;DR
- Key Takeaways
- 01 The 1,600-tonne rule and where it came from
- 02 The two-layer conversion chain
- 2.1 Scope: cell-level CAM
- 2.2 The chemistry layer: practical capacity × average voltage
- 2.3 The yield layer: a scenario, not a standard
- 03 Eight materials, one table
- Commercialization status
- 04 What official numbers confirm
- 05 SOC, N/P ratio, and what they do not change
- 06 What to watch
- Model assumptions and data basis
- References
What 10,000 Tonnes of Cathode Is Actually Worth in GWh
TL;DR
The same 10,000 tonnes of cathode active material (CAM) yields 7.1 GWh in an NCM811 cell but only 2.8 GWh in an NFPP sodium-ion cell — a 2.5× spread that a single "1,600 t/GWh" rule of thumb cannot capture. That figure originated from a 2021 investor-relations reply about NCM523/622 and has outlived the chemistry mix it was built for. The conversion chain has only two layers — chemistry and a manufacturing-yield scenario — and every number in the eight-material table below can be reproduced from first principles.
Key Takeaways
- NCM811 packs 7.1 GWh per 10,000 t; NFPP packs 2.8 GWh — a 2.5× gap driven by specific capacity and voltage.
- The "1,600 t/GWh" rule dates from a 2021 NCM523/622 era. In 2025, LFP accounted for 77.4% of China's cathode output by tonnage (GGII, full-year); the old coefficient underestimates LFP and overestimates high-nickel NCM.
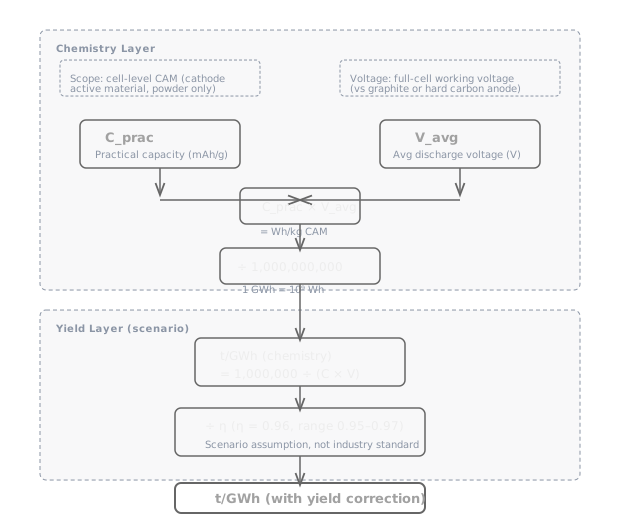
- The two-layer conversion is: t/GWh = 1,000,000 ÷ (C_prac × V_avg), then ÷ η for manufacturing yield. No hidden steps.
- η = 96% (range 95–97%) is a scenario assumption, not an industry standard. Each 1-percentage-point shift changes t/GWh by roughly 1%.
- Official disclosures from cathode and cell makers align with the model at the same order of magnitude — within 0.6–4.8% for the core comparisons — but no maker specifies whether their figure includes manufacturing losses.
- NCM9-series delivers 7.3 GWh per 10,000 t versus NFPP's 2.8 GWh — a 2.6× ratio. Phosphate systems carry systematically higher t/GWh than ternary, a consequence of voltage and capacity, not process inefficiency.
01 The 1,600-tonne rule and where it came from
The "1,600 t/GWh" figure has a documented origin. On September 13, 2021, Easpring (当升科技) replied on a Chinese investor-relations platform: "producing 1 GWh of ternary lithium batteries requires approximately 1,500–1,800 tonnes of ternary cathode material." The statement did not distinguish between NCM523, NCM622, or NCM811. The value 1,600 falls within that interval and is close to NCM622 estimates (~1,616 t/GWh from one brokerage compilation).
During September–November 2021, a period of sharp lithium carbonate price increases, multiple listed cathode makers responded to similar investor queries. The "1,600" shorthand was picked up broadly by industry media, and its provenance was gradually lost.
The coincidence with NCM622 reinforced the figure's authority: 2020–2022 was the period when 5- and 6-series NCM dominated ternary shipments. The coefficient worked in the era it was built for.
The evidence that the coordinate system has shifted is in the shipment mix. Per GGII (2025 full year), China's cathode material shipments reached 5.025 million tonnes (+50% YoY), of which LFP accounted for approximately 3.89 million tonnes or 77.4% (+58%); ternary was 830,000 tonnes or 16.5%, with 6-series dominant and 8/9-series shares declining. The old coefficient was calibrated for a ternary-dominant world that no longer exists.
1,600 t/GWh is roughly correct for NCM622, too low for LFP (2,000+), too high for NCM811/9-series, and understates sodium-ion cathode needs by about 55% — 1,600 is only approximately 45% of the NFPP estimated unit consumption of 3,543 t/GWh.
My take: "1,600 t/GWh" is a period coefficient, not a law of nature. Using it today for a mixed-chemistry pipeline is like pricing all lithium cathode at LFP rates — directionally misleading at the portfolio level.
02 The two-layer conversion chain
2.1 Scope: cell-level CAM
Every t/GWh figure in this article refers to cell-level cathode active material (CAM) — the powder that actually stores lithium (or sodium), excluding conductive carbon, binder, and current collector. Most industry shipment statistics use this CAM definition, though the reader should verify the specific institution's definition. CAM tonnage must not be mixed with cathode-sheet or precursor tonnage.
2.2 The chemistry layer: practical capacity × average voltage
The core formula is:
t/GWh = 1,000,000 ÷ (C_prac × V_avg)
where C_prac is practical specific capacity (mAh/g) and V_avg is average discharge voltage (V). Their product gives Wh/kg of CAM. Dividing 1 GWh (= 10⁹ Wh) by that figure yields kilograms per GWh, converted to tonnes.
Voltage is pinned to the full-cell working voltage — lithium-ion materials against graphite anode (NCM 3.7V/3.6V, LFP 3.2V), sodium-ion materials against hard carbon anode (NFPP 3.0V, NFM 3.0V, NFS 3.5V). The table does not use the half-cell potential of the cathode versus lithium or sodium metal. Mixing half-cell voltages into a cross-chemistry comparison systematically underestimates t/GWh for sodium-ion systems.
Practical capacity is the half-cell reversible capacity — the common benchmark in academic literature and supplier datasheets. It differs from full-cell usable capacity after formation (first-cycle loss, SOC window, rate effects). The chemistry layer uses this definition and does not apply an additional formation deduction.
Average voltage is defined as V_avg = ∫V(Q)dQ/Q — the integral of voltage over capacity divided by total capacity. This is not the plateau or median voltage. For flat discharge curves the three converge; for sloping curves (notably sodium-ion materials) the integral definition must be used.
A worked example for NCM811: 200 mAh/g × 3.70 V = 740 Wh/kg; 10⁹ Wh ÷ 740 Wh/kg = 1,351,000 kg ≈ 1,351 t/GWh, meaning 10,000 t yields roughly 7.4 GWh before yield correction.
2.3 The yield layer: a scenario, not a standard
The chemistry layer gives an ideal value. In practice, a loss chain runs from coating through assembly to formation and grading.
The correction factor is η = 0.96 (range 95–97%), a scenario assumption — not an industry-wide utilization rate. Public data points (Tesla 4680 dry-electrode yield >90% per electrode, mature-system comprehensive yield >98%, post-formation below-A-grade share <10%, 20 GWh factory yield improvement of 3 percentage points) use different denominators and cannot be collapsed into a single utilization figure. Readers can substitute their own η.
Each 1-percentage-point change in η shifts t/GWh by roughly 1%: η = 95/96/97/98% corresponds to multipliers of ×1.0526 / ×1.0417 / ×1.0309 / ×1.0204.
Formation and grading is the final quality gate before cell warehousing, accounting for approximately 15% of lithium-ion equipment capex and roughly 40% of line energy consumption. Losses at this stage are captured in the yield layer and do not duplicate the chemistry-layer practical capacity.
My take: The two-layer structure is deliberately simple. A real factory model has dozens of yield points; this handbook collapses them into one parameter the reader can see and override. That is a feature, not a limitation — as long as the user understands they are looking at an engineering estimate, not a production recipe.
03 Eight materials, one table
The table below covers eight cathode chemistries — three NCM variants, two LFP generations, and three sodium-ion routes. All figures use the cell-level CAM, full-cell voltage, and 96% yield-correction definitions from §02.
| Material | C_prac (mAh/g) | V_avg (V) | t/GWh (chemistry) | t/GWh (incl. 96%) | GWh / 10,000 t (incl. 96%) |
|---|---|---|---|---|---|
| NCM523 | 165 | 3.70 | 1,638 | 1,706 | 5.9 |
| NCM811 ★ | 200 | 3.70 | 1,351 | 1,408 | 7.1 |
| NCM9-series | 210 | 3.60 (conservative est.) | 1,323 | 1,378 | 7.3 |
| LFP Gen 3 ★ | 155 | 3.20 | 2,016 | 2,100 | 4.8 |
| LFP Gen 4 | 160 | 3.20 | 1,953 | 2,035 | 4.9 |
| NFPP ★ | 98 | 3.0 | 3,401 | 3,543 | 2.8 |
| NFM | 125 | 3.0 (eng. estimate) | 2,667 | 2,778 | 3.6 |
| NFS | 95 | 3.5 | 3,008 | 3,133 | 3.2 |
| ★ Anchor verification: NCM811 → 1,000,000 ÷ 740.0 = 1,351 ✓; LFP Gen 3 → 1,000,000 ÷ 496.0 = 2,016 ✓; NFPP → 1,000,000 ÷ 294.0 = 3,401 ✓. Rounding note: the "incl. 96%" column uses precise Wh/kg values; NFPP precise chain gives 3,400/3,542 — unit-digit difference of 1 is a rounding artifact, not a precision claim. | |||||
NCM9-series at 7.3 GWh per 10,000 t delivers 2.6× the energy of NFPP at 2.8 GWh — a gap rooted in voltage and capacity, not manufacturing maturity. Phosphate cathode systems carry systematically higher t/GWh than ternary: LFP Gen 3 at 2,100, NFPP at 3,543 t/GWh (both with 96% correction). This is the combined effect of lower specific capacity and (for sodium-ion) lower full-cell voltage.
Commercialization status
| Material | Status |
|---|---|
| NCM523 | Mature, declining (5-series vehicle share falling rapidly) |
| NCM811 | Mature workhorse (2025 share declining, volume still significant) |
| NCM9-series | In volume production; ~14% of premium EV installations in 2025 (SMM) |
| LFP Gen 3 | Mature dominant chemistry (LFP overall: 77.4% of China's cathode shipments by tonnage, GGII) |
| LFP Gen 4 | Ramping; Dynanonic reported Gen 4 high-compaction share of 20–30% in H1 2025, Gen 5 in pilot |
| NFPP | Industrialized; polyanion cathodes account for ~70% of Na-ion cathode; global Na-ion cathode shipments ~20,000 t in 2025 |
| NFM | Commercializing; two-wheeler and EV applications; CATL's Naxtra (钠新) sodium-ion platform as representative |
| NFS | First year of mass production; Zhongna Energy's Meishan facility (company-claimed world's first 10,000 t-class base) started production January 2026, Phase 1 = 10,000 t/yr cathode + 2 GWh PACK |
04 What official numbers confirm
Official disclosures from cathode and cell makers provide an order-of-magnitude cross-reference for the model. None of these companies specifies whether their figure includes manufacturing losses; none uses the single value "1,600."
| Company | Chemistry | Disclosure (t/GWh) | Two-layer model | Gap | Notes |
|---|---|---|---|---|---|
| Easpring (2021-09-13) | Ternary (unspecified) | 1,500–1,800 | NCM523 w/ 96%: 1,706; NCM622 w/ 96%: ~1,683 | Within interval | A-class source |
| Sunwoda (2024-07-05) | Ternary fast-charge | ~1,400 | NCM811 w/ 96%: 1,408 | 0.6% | A-class source |
| Xiangtan Electrochemical | LFP | ~2,000 | LFP Gen 3 chemistry-only: 2,016 | 0.8% | A-class; see note 1 |
| Sunwoda (2024-07-05) | LFP fast-charge | ~2,200 | LFP Gen 3 w/ 96%: 2,100 | 4.8% | A-class source |
| Dynanonic (2021-09-09) | LFP | 2,200–2,500 | LFP Gen 3 w/ 96%: 2,100 | +4.8–19% | Upper-bound reference |
| Note 1: Xiangtan Electrochemical's disclosure came via an investor-relations platform. The company's main business is not LFP — its affiliate Hunan Yuneng is a leading LFP producer. The business-scope attribution could not be independently verified; this row is included as reference only and is not counted in the cross-validation conclusion. Note 2: The NCM622 model-back value of ~1,683 uses 172 mAh/g × 3.6 V with 96% correction (1,616 ÷ 0.96 ≈ 1,683), consistent with the brokerage compilation figure of 1,616. | |||||
Easpring's disclosed interval (1,500–1,800) directly brackets the model-back values for NCM523 (1,706) and NCM622 (~1,683). The remaining pairs show gaps of 0.6–4.8%, within the model's engineering-estimate range.
My take: Official disclosures confirm the model is in the right order of magnitude. They do not validate it to ±1% — and the model does not claim that precision. When a company says "~2,000 t/GWh," the useful question is whether your own planning model is in the same ballpark, not whether the digits match exactly.
05 SOC, N/P ratio, and what they do not change
State of charge (SOC) buffers reduce usable pack energy, not the cell-level conversion. In the vehicle samples cited (Ford Mustang Mach-E, GM Bolt, Tesla), usable-to-nominal ratios ranged from 88.5% to 98.5%. Ford's Mach-E reserves 10–11% (68/76.8 = 88.5% — notably, Ford reports usable capacity directly, the most transparent practice). GM Bolt reserves 1.5% (65/66 = 98.5%). Tesla reserves approximately 4.5% (~95.5%). These figures are limited to the cited vehicle samples and should not be generalized as "typical ~90%."
The nominal energy obtained by summing cell-rated capacities is arithmetically unchanged by pack configuration. Pack-level usable energy is typically lower; "real usable energy" is a function of the depth-of-discharge (DOD) window, not of the cell-to-GWh conversion chain.
N/P ratio does not enter the conversion chain. The negative-to-positive capacity ratio (typically 1.05–1.20) is adjusted by varying anode thickness while holding the cathode side constant. Kim et al. (Electrochimica Acta 2015) demonstrated anode thicknesses of 124/135/146 μm corresponding to N/P = 1.10/1.20/1.30 at fixed anode compaction density. In this article's first-principles model — where cathode usable capacity is pre-fixed — N/P is not an independent multiplier. In real cell design, N/P influences capacity utilization indirectly through first-cycle efficiency and SOC window.
06 What to watch
LFP Gen 4 and Gen 5 ramp. The conversion table shows Gen 4 at 2,035 t/GWh (with 96% correction) versus Gen 3's 2,100 — a modest improvement driven by higher compaction and practical capacity. If Gen 4 displaces Gen 3 as the volume standard, the weighted-average t/GWh for the dominant chemistry shifts downward. Track Dynanonic's quarterly disclosures on Gen 4/Gen 5 share.
Sodium-ion cathode shipment growth. Global Na-ion cathode shipments were approximately 20,000 tonnes in 2025. NFPP at 3,543 t/GWh means that volume translates to roughly 5.6 GWh of cell capacity — still small. If shipments scale to 100,000 t, the installed GWh base becomes material. Track whether polyanion routes (NFPP, NFS) maintain their share versus layered-oxide routes (NFM).
NCM9-series penetration. At approximately 14% of premium EV installations in 2025 (SMM), NCM9-series is the only ternary sub-segment still growing. Its 7.3 GWh per 10,000 t makes it the most GWh-efficient cathode in the table. If 9-series share expands, the ternary fleet's average GWh-per-tonne improves — a factor that the "1,600" rule entirely misses.
My take: The three indicators above share one theme: chemistry mix is the dominant variable in any tonne-to-GWh conversion. Get the mix wrong, and the installed-capacity estimate is off by a factor, not a percentage.
Model assumptions and data basis
This is a first-principles engineering estimate, not a production model.
- Capacity input: half-cell reversible capacity (literature and supplier data). Full-cell usable capacity after formation is lower due to first-cycle loss, SOC window, and rate effects. The chemistry layer uses the half-cell definition and does not apply a separate formation deduction.
- Voltage input: full-cell average discharge voltage versus the respective anode (graphite for Li-ion, hard carbon for Na-ion). The average is defined as V_avg = ∫V(Q)dQ/Q.
- Yield correction: η = 0.96 (scenario, range 0.95–0.97). Not an industry-wide utilization rate. Readers can substitute their own value.
- Limitations: the combination of half-cell capacity and full-cell voltage is a first-order approximation. Error should be understood as an interval, not a point estimate. The model does not capture cell-to-cell variation, formation protocol differences, or pack-level losses.
- GGII shipment data: 2025 full-year China cathode material shipments, reported as of 2025.
- SMM data: NCM9-series installation share, premium EV segment, 2025.
- No currency figures appear in this article. All quantities are in t/GWh, mAh/g, V, or %.
References
- Easpring investor-relations reply, 2021-09-13 — "1,500–1,800 tonnes of ternary cathode per GWh." (A-class)
- Sunwoda investor-relations reply, 2024-07-05 — ternary fast-charge ~1,400 t/GWh; LFP fast-charge ~2,200 t/GWh. (A-class)
- Dynanonic investor-relations reply, 2021-09-09 — LFP 2,200–2,500 t/GWh. (A-class)
- Xiangtan Electrochemical investor-relations reply — LFP ~2,000 t/GWh. (A-class; business-scope attribution unverified)
- GGII — 2025 full-year China cathode material shipments: 5.025 Mt total, LFP 3.89 Mt (77.4%), ternary 830,000 t (16.5%). (B-class)
- SMM — NCM9-series premium EV installation share ~14%, 2025. (B-class)
- Kim et al., Electrochimica Acta 2015 — N/P ratio vs anode thickness. (B-class)
- Yamada 2014 — NFS (Na₂Fe₂(SO₄)₃, alluaudite structure). (B-class)
- NFS@C@CNTs study — NFS full-cell voltage 3.5 V vs hard carbon. (B-class)
- Sigma-Aldrich — NFM material-level nominal voltage 3.1 V. (B-class)
- MTI — NFMO + hard carbon 7 Ah pouch, 1.5–4.0 V window. (B-class)
- Cambridge DoITPoMS — average voltage definition. (B-class)
- NCM90-Zr2 study — 215.5 mAh/g reversible to 4.5 V cutoff. (B-class)
- EVreporter — post-formation below-A-grade share <10%. (B-class)
- Tesla shareholder communication — 4680 dry-electrode yield >90% per electrode. (A-class)
- Dynanonic 2025 H1 report — Gen 4 high-compaction share 20–30%, Gen 5 in pilot. (A-class)
- Zhongna Energy Meishan base announcement — 10,000 t/yr NFS + 2 GWh PACK, January 2026. (A-class; company-claimed)
- xdrea industry article — NFPP rated working voltage ~3.0 V, 0.2C, 100% DOD 2.0–4.0 V. (C-class)
- Mature-system comprehensive yield >98% — industry media. (C-class)
- EVreporter / Siemens TWh-era white paper — formation capex ~15%, energy ~40%. (B-class)