Table of Contents ▼
- TL;DR
- Key Takeaways
- 01 The queue is a filter, not a pipeline
- 02 Storage solves time; transmission solves distance
- 03 New load is arriving on an old-growth grid
- 04 Transmission cannot be replenished in one cycle
- 05 Network upgrades rewrite project economics
- 06 The scarce asset is bankable grid access
- 07 What to watch
- Data basis and notes
The Queue Is Not a Pipeline: Why US Storage Lives or Dies on Transmission
TL;DR
This article's data scope is the United States. The US interconnection queue held about 2,060GW at end-2025, including roughly 749GW of storage, but a queue entry is an option on grid access—not a construction plan. Of capacity entering the queue in 2000–2020, only 13.1% had reached operation and 75.1% had withdrawn by end-2025. Batteries can move electricity across hours at one node; only transmission can move it between resource regions and load centers. As interconnection timelines and network-upgrade exposure rise, bankable grid access is becoming more scarce than battery hardware.
All monetary figures are in USD as reported by the original sources; no currency conversion is applied. Queue and cost data: LBNL Queued Up 2026 and LBNL interconnection-cost briefing (data through end-2025). Operating battery figures are preliminary EIA-860M data. Regional queue-to-operating ratios are a pressure proxy, not a growth forecast.
Key Takeaways
- The active US queue held about 8,200 projects and 2,060GW at end-2025; storage accounted for roughly 749GW.
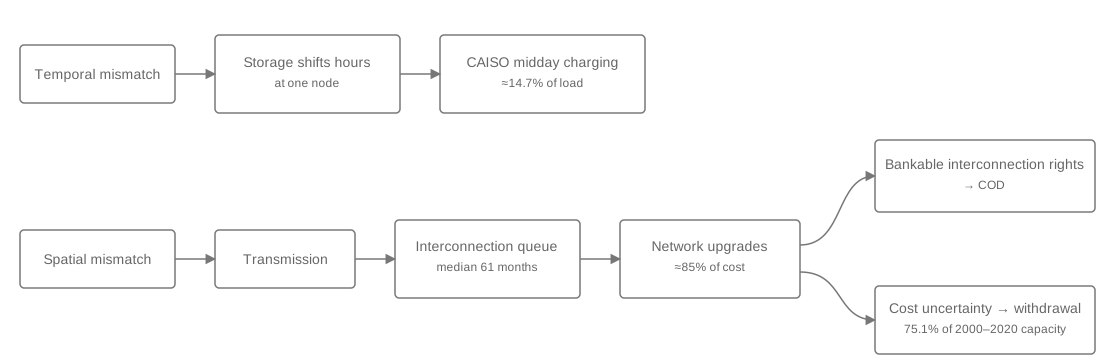
- For projects built in 2025 with complete timing data, the median request-to-commercial-operation interval was 61 months (≈5 years).
- Storage addresses a temporal mismatch; transmission addresses a spatial mismatch.
- US real GDP rose 39.3% from 2007 to 2024 while electricity sales rose only 5.6%.
- In a non-ISO balancing-authority sample, completed projects averaged $194/kW of interconnection cost versus an estimated $671/kW for withdrawn projects.
01 The queue is a filter, not a pipeline
The US interconnection queue measures demand for grid access, not future installed capacity.
Lawrence Berkeley National Laboratory (LBNL), a US Department of Energy national laboratory, counted about 8,200 active generation and storage projects totaling roughly 2,060GW at end-2025. Storage represented about 749GW. These are applications, often with overlapping commercial options, not a project forecast.
The historical filter is severe. Of capacity that entered the queue from 2000 through 2020, 13.1% had reached operation and 75.1% had withdrawn by end-2025. Withdrawn does not mean every project failed; it means that capacity left the queue before operation.
For projects built in 2025 with complete timing data, the median interval from interconnection request to commercial operation date (COD) was 61 months (≈5 years).
| Indicator | Value | Unit | Scope and basis |
|---|---|---|---|
| Active projects | ~8,200 | projects | Generation plus storage |
| Active capacity | ~2,060 | GW | Generation plus storage |
| Generation capacity | 1,312 | GW | Active queue |
| Storage capacity | ~749 | GW | Power capacity, not energy |
| Median request-to-COD | ~61 | months | Projects built in 2025 with complete timing data |
| Reached operation | 13.1 | % | Capacity entering in 2000–2020 |
| Withdrawn | 75.1 | % | Same cohort; not a failure rate |
My take: Treating queue capacity as a sales pipeline is a category error. The investable asset is a project that can survive studies, cost allocation and financing long enough to secure bankable interconnection rights.
02 Storage solves time; transmission solves distance
Storage and transmission solve different physical constraints.
The duck curve is the daily net-load shape in which solar output depresses midday grid demand before demand rises sharply in the evening. Batteries are well suited to that temporal mismatch: in CAISO, the California grid operator, midday battery charging power in 2024 was about 14.7% of balancing-area load.
But batteries at one node cannot deliver power around a constrained corridor. California curtailed about 3.4TWh of wind and solar generation in 2024, up 29% from 2023. In ERCOT, the Texas power system, congestion curtailed more than 4% of wind generation and nearly 6% of solar generation in 2024.
A battery can shift energy from noon to evening; it cannot turn a remote resource zone into a load center.
The distinction matters across the seven major independent system operator and regional transmission organization markets—ISO/RTOs, the entities that operate grids and wholesale markets across most of the country.
| Market | Operating battery (MW) | Active storage queue (MW) | Ratio (×) |
|---|---|---|---|
| ISO-NE | 1,020 | 7,067 | 6.9 |
| CAISO | 16,009 | 111,563 | 7.0 |
| ERCOT | 16,307 | 165,315 | 10.1 |
| NYISO | 262 | 13,201 | 50.4 |
| PJM | 644 | 42,676 | 66.3 |
| MISO | 1,166 | 87,064 | 74.7 |
| SPP | 488 | 50,850 | 104.3 |
My take: A high ratio is evidence of study and infrastructure pressure, not proof of future market growth. It says more about the volume competing for today's grid than about what will be built.
03 New load is arriving on an old-growth grid
The United States is entering a new electricity-demand cycle after decades in which the economy grew much faster than power sales.
From 2007 to 2024, real GDP in 2017 chained dollars increased 39.3%, while electricity sales to ultimate customers increased only 5.6%. Efficiency, structural economic change and flat demand shaped utility planning for much of that period.
Now the demand mix is changing. US data centers consumed 176TWh in 2023; the Department of Energy, drawing on LBNL's 2024 Report on US Data Center Energy Use, forecasts 325–580TWh in 2028. That range is not a guaranteed outcome.
The grid is being asked to absorb a new load cycle with infrastructure planned during a flat-sales era.
My take: The demand forecast can miss and the transmission problem can still remain. Large loads and generation projects cluster geographically, so location and delivery paths matter as much as aggregate terawatt-hours.
04 Transmission cannot be replenished in one cycle
Transmission supply responds on a different clock from batteries, data centers and generation projects.
The Department of Energy's National Transmission Planning Study estimates that, under its low-cost current-policy scenario, the contiguous US transmission system in 2050 would need to reach 2.1–2.6 times its 2020 size. Yet additions of lines rated 345kV and above fell from nearly 4,000 miles in 2013 to about 322 miles (520km) in 2024.
Typical large-power-transformer lead times moved from 12–18 months historically to 30–36 months in recent years. Permitting, cost allocation and local siting decisions add separate clocks.
Waiting alone can kill a project: transmission rights, studies and equipment procurement can run beyond one commercial cycle.
My take: This is not simply a construction-speed problem. It is a coordination problem across institutions that approve, allocate and finance different pieces of one network.
05 Network upgrades rewrite project economics
Interconnection cost uncertainty can remove financeability before a project reaches construction.
In LBNL's sample of non-ISO balancing authorities from 2018 to 2024, completed projects had observed mean interconnection costs of $194/kW. Withdrawn projects carried an estimated $671/kW. Network upgrades accounted for about 85% of total interconnection cost in the same sample.
| Project outcome | Mean cost (USD/kW) | Basis |
|---|---|---|
| Completed | 194 | Observed mean |
| Withdrawn | 671 | Estimated mean |
| Network-upgrade share | ~85% | Share of total interconnection cost |
The project is often paying for the grid's catch-up, not merely for a cable to its own site. Under high interest rates, an uncertain upgrade bill also consumes more time and financing capacity.
My take: Cheaper cells improve the spreadsheet, but they do not cap an open-ended network-upgrade obligation. The commercial unit of competition is shifting from the cell to the grid-ready project.
06 The scarce asset is bankable grid access
The strongest US storage projects combine the right technology with the right node and enforceable delivery rights.
The logic is self-reinforcing. A congested region produces more studies and upgrades; longer studies increase holding costs; uncertain allocations weaken financing; withdrawals then send projects back through a queue that still looks enormous on paper.
Battery prices determine whether the math pencils out. Grid location determines whether the project can be built.
My take: The next durable advantage in US storage is not another marginal reduction in cell cost. It is a portfolio of sites with bankable interconnection rights, controlled upgrade exposure and credible paths to COD.
07 What to watch
Three indicators will show whether the constraint is easing.
First, track median request-to-COD time for newly completed projects, with the sample definition intact. A shorter queue on paper matters less than a shorter path to operation.
Second, track annual additions of 345kV-and-above transmission and large-power-transformer lead times. Together they reveal whether physical delivery capacity is catching up with applications.
Third, track completed-versus-withdrawn interconnection cost and the network-upgrade share. A queue becomes more investable only when its timelines and cost allocations become financeable.
Data basis and notes
- Data scope is the United States; Canada and Mexico are outside the calculations.
- Queue data are from LBNL's Queued Up 2026 and cover conditions through end-2025. Queue capacity is not a build forecast.
- The operating-battery denominator uses preliminary EIA-860M May 2026 nameplate capacity; the queue numerator uses LBNL active storage capacity through end-2025.
- The GDP and electricity-sales indexes use US Energy Information Administration Monthly Energy Review data. The chart includes 2025 as the last available preliminary observation.
- Interconnection costs are limited to LBNL's non-ISO balancing-authority sample for 2018–2024 and are not national averages.
- All monetary figures are native USD; no currency conversion is applied.